 Motion analysis with the GDK scope
Getting Started
The purpose of this exercise is to plot a simple waveform with the GDK Scope. The following are the required components to perform this exercise.
- GDK supported Galil controller.
- A computer running the latest version of GDK software.
- A GDK Pro license.
Connect to the Controller
- To connect the Scope to the desired controller, first make sure that the correct address is aliased in the GDK Manager.
- Open the Scope
 by clicking the respective icon in the GDK Manager toolbar.
 - The Scope should automatically connect to the controller selected in step 1.
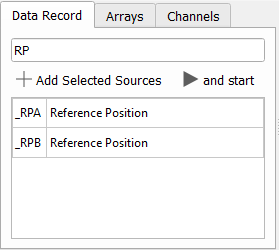
Selecting Scope Channels
- Type RP in the Available Channels tab of the Scope to search for the Reference Position channel. Double click on _RPA.
- Type BG and double click on _BGA.
Write a Simple Profile
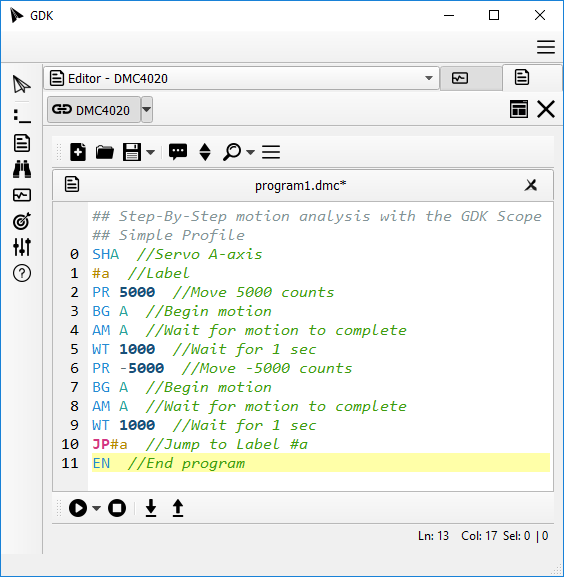
As seen in the figure below, open an Editor and create the following program, then download and execute it by typing the hot key combination Ctrl + Shift + D. This program will loop continuously until the program is stopped by issuing the ST command from the Terminal or by clicking the Stop Program button in the Editor.
## Step-By-Step motion analysis with the GDK Scope
## Simple Profile
SHA  //Servo A-axis
#a  //Label
PR 5000  //Move 5000 counts
BG A  //Begin motion
AM A  //Wait for motion to complete
WT 1000  //Wait for 1 sec
PR -5000  //Move -5000 counts
BG A  //Begin motion
AM A  //Wait for motion to complete
WT 1000  //Wait for 1 sec
JP#a  //Jump to Label #a
EN  //End program
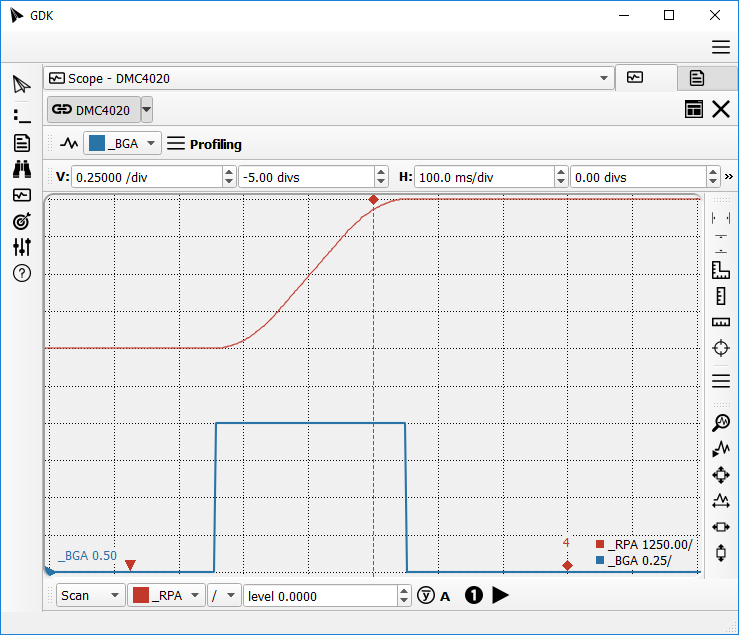
Start the Scope
- Set the Trigger Mode to Scan. If
plotting does not start automatically, start the scope by clicking the
Run/Stop
 button in the
trigger toolbar.
button in the
trigger toolbar. - Click the
Zoom into waveform extents
 button.
Triggering
- Set the Triggering Channel to _BGA on the Rising Edge and set the Trigger Mode to Normal.
- Click the Set trigger level to data mean
 button.
 - To display the waveforms shown below, edit the Horizontal Scale to be 300 ms/div.
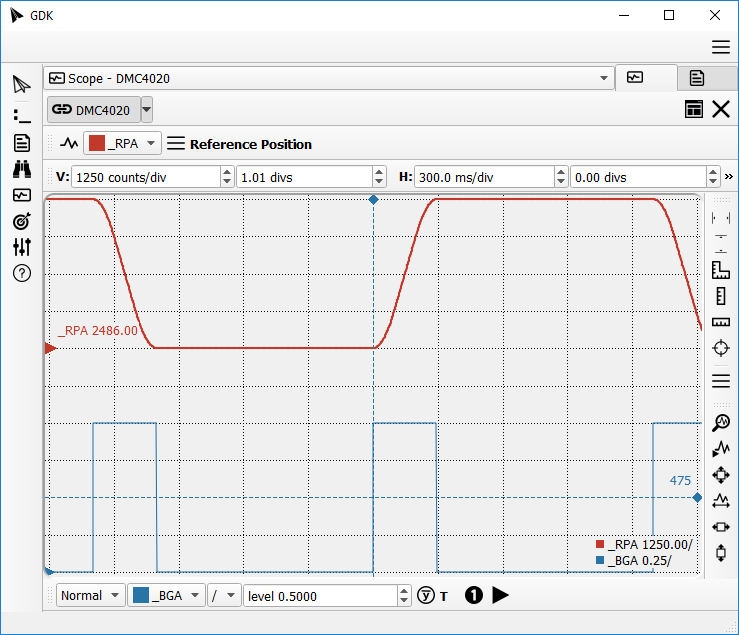
As seen above, _BGA is indicating when the profiler is and isn't active. When _BGA=1, the controller is profiling motion so _RPA is changing. Conversely, when _BGA=0 the controller is not profiling motion so _RPA is not changing.
Conclusion
In just a few quick steps, a variety of useful controller information can be graphically displayed to help in tuning, analysis, and troubleshooting for an application. From here, features can be leveraged such as different forms of triggering, adding more channels, changing channel scale, and measuring data output.
![]()