 The Scope Tool
Description
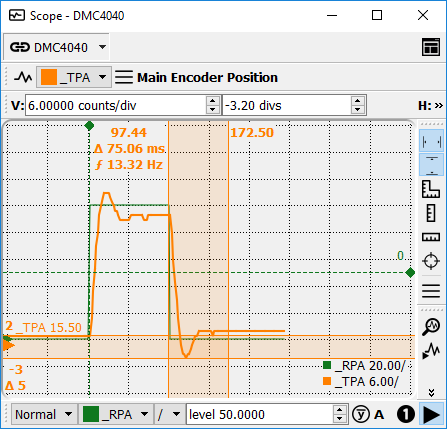
The GDK Scope provides a tool modeled from a hardware-based oscilloscope for graphing controller data verses time.
A number of data manipulation, zooming, measuring, and triggering tools are provided.
Oscilloscope Basics
A source of data is called a channel. The GDK Scope can plot an arbitrary number of channels. Data is usually gathered from the controller's data record, however controller array data can be graphed, along with data from imported files.
Each channel is plotted as a continuous line that spans across a given time interval. The newest data is on the far right of the plot, and the oldest is at the far left. Array data and static, duplicated channels may not always expand to the edges of the scope.
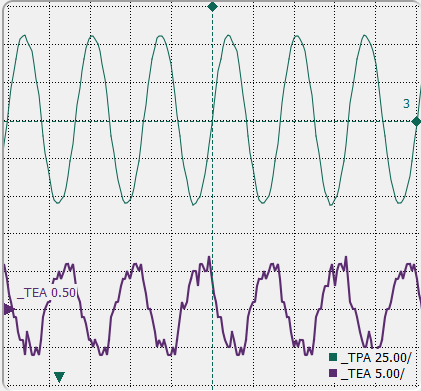
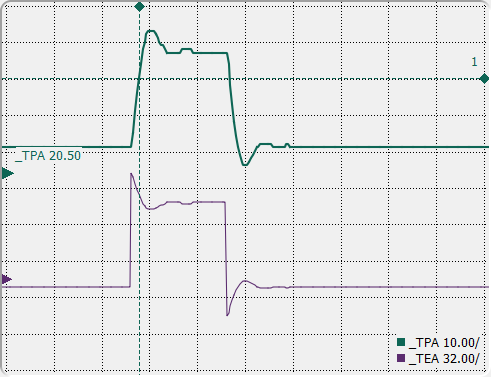
The Scope draws channel waveforms on a plot area that is ten divisions (divs) wide by ten divs tall. The divs are painted on the scope in a graticule that resembles graph paper.
Vertical lines measure the horizontal divs, representing time. Horizontal lines measure vertical divs, representing the data of the channel. Therefore, the units of the horizontal divs are milliseconds, while the units of vertical divs are a function of the channel.
The divs are numbered zero at the centers, to +/- 5 at the top and bottom, and right and left.
The measured value between each div is variable, and is set in the Horizontal and Vertical controls.
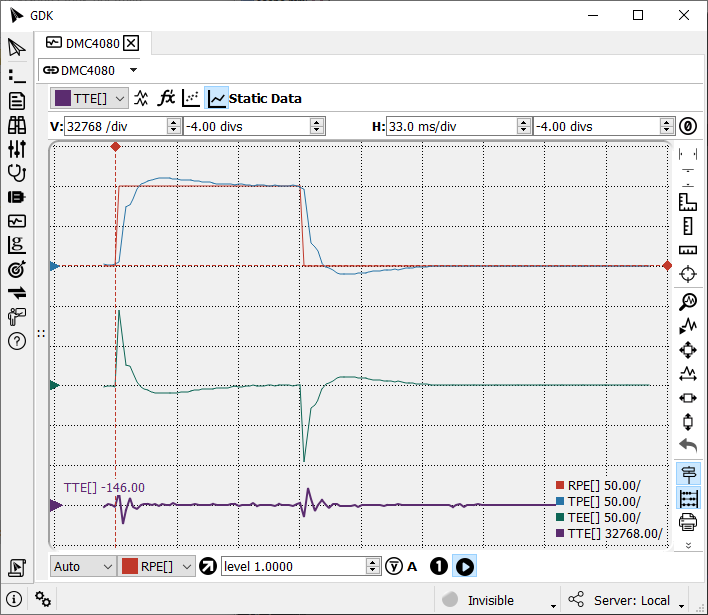
The time axis has the notion of a time offset. The offset defaults to the middle div, and is indicated by a vertical dotted line that is bolder than the divs graticule. The time at this point is relatively defined as t=0. See the vertical blue line in the plot above.
The data axis has the notion of a trigger offset. It is represented by a horizontal dotted line that is bolder than the divs graticule. More information on triggering is outlined in the Triggering section. See the horizontal blue line in the plot above.
Channels
The Channels Sidebar
The left side of the scope contains the Channels Sidebar. Use the sidebar to add data record sources, add arrays, remove channels, and manage channels in a tabular form. The vertical bar bewteen the sidebar and the plotting area can be dragged to enlarge or hide the sidebar.
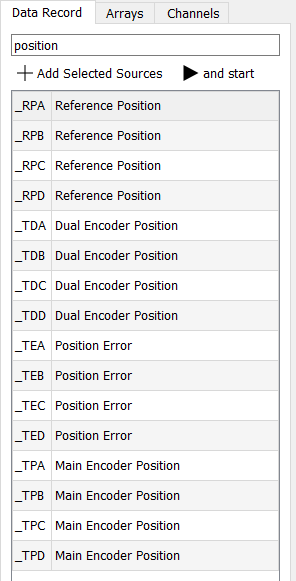
Adding Data Record Channels
Data Record Channels are added to the scope via the Data Record tab of the Scope channels sidebar. Once connected to hardware, the data record sources will populate. Type a term in the search box to show all related channels.
Select the desired channel(s) and click ![]() Add Selected Sources, or
type Enter to add selections. Alternatively,
click
Add Selected Sources, or
type Enter to add selections. Alternatively,
click ![]() and start to add the selected channels,
start the scope, and hide the channels chooser.
and start to add the selected channels,
start the scope, and hide the channels chooser.
Some data record data is affected by settings on the controller. For example, the AQ command affects the scaling of analog inputs. Setting up these commands first, before opening a Scope and adding data record channels, will ensure that the data is interpreted correctly.
Adding Array Data
In order to plot the data in an array, use the Arrays tab of the Scope channels side bar.
Click ![]() List Arrays to query the controller for the current array
table. Select the desired arrays and click
List Arrays to query the controller for the current array
table. Select the desired arrays and click ![]() Upload Selected Arrays
to add them to the scope as channels. This will also update any array data
if the selected arrays have already been added as channels.
Upload Selected Arrays
to add them to the scope as channels. This will also update any array data
if the selected arrays have already been added as channels.
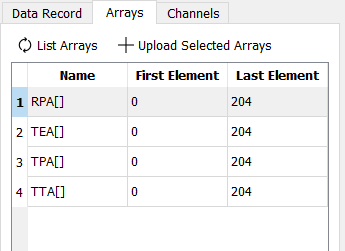
In very special cases, arrays are used for diagnostics and tuning. The record array feature (RC/RD/RA) of the controller can be used for recording data for low-TM tuning and other diagnostics. See ms/Point and Linked below for time considerations when working with Array data.
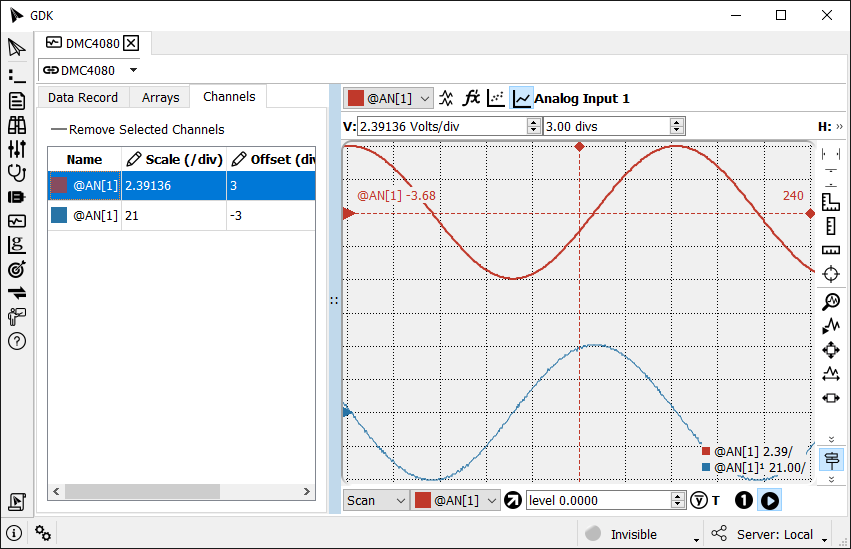
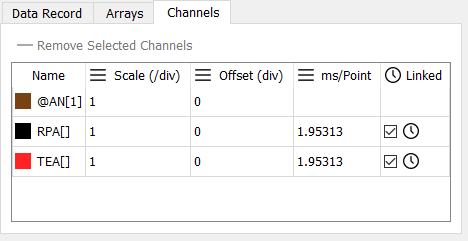
Tabular Channels View
The Channels tab of the Scope channels sidebar contains all the channels that have been added to the scope. It provides access to the most commonly used Channel settings such as vertical scale and offset.
Removing Channels
Channels can be removed from the scope by selecting them in the Channels tab of the Scope channels sidebar and clicking
![]() Remove Selected Channels.
Remove Selected Channels.
Name
The Name column contains the name of the channel along with the waveform color.
Arrays will contain the dimension of the array in brackets. The ms/Point and Linked columns will also be present for arrays.
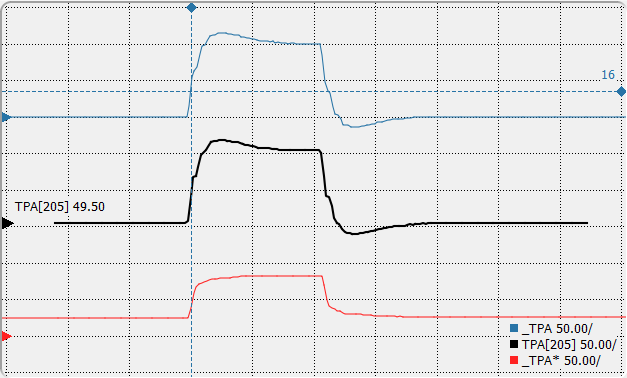
Static data, as from duplicated channels or imported data, will have an asterisk at the end of the name. The Linked column will also be present for static data.
Mousing over a channel name will display a tooltip with its description, where available.
Scale
The scale column defines the scale per vertical div for each channel. Mousing over a channel scale will display a tooltip with its units, where available.
It is often desirable to change the scale of multiple channels at once. For
example, when tuning, RP, TP, and TE often should be the same scale. To
change scales in batch, select the desired channels and click the
![]() icon next to the Scale
column header.
icon next to the Scale
column header.
Offset
The offset column defines the vertical offset, in divs for each channel.
As with Scale, change the Offset for all selected channels by clicking the
![]() icon next to the Offset
column header.
icon next to the Offset
column header.
ms/Point
ms/Point sets the time interval between sample of array data.
A common use of array data is high speed recording with RC1.
Because of this, GDK will automatically set the time between points to
two samples at the current TM. Use the ![]() icon
next to the ms/Point column header to change times for multiple
channels.
icon
next to the ms/Point column header to change times for multiple
channels.
Linked
Data record sources share a time reference. Array data and static data do not. Tick the Linked checkbox for all array and static data that should be shifted in time together. For example, when tuning with array data, triggering on RP should cause an equal time shift on TP, TE, TT, etc.
Axis Banks
The DMC-52000 has an additional column, Bank, which allows the axis group to be selected for plotting. See the DMC-52000 user manual for more information on axis banking.
The Ground Indicator
In keeping with the model of a hardware oscilloscope, each channel displays a ground indicator. This mark is where the data value is zero. Moving the vertical offset will cause the ground indicator to move appropriately.
If the Scope is configured in such a way that the zero is off screen, the ground arrow will point up or down, to the direction of where the zero exists off-plot.
The Selected Channel
The Scope uses the notion of a selected channel for interacting with the channel with the scope controls. The vertical controls, zooming, measuring, and other various on-screen interactions operate on the selected channel.

Selected channel menu, duplicate channel, derivative, show points, show/hide channel, and channel description.
Selected Channel Toolbar Detail
- Selected Channel - The currently selected channel and color. Click to change the selected channel.
- Duplicate Curve - Create a new, static, channel with the selected curve's current data. This is particularly useful when comparing signals during tuning.
- Plot the derivative - Plot the discrete derivative instead of the data directly.
- Show channel points - Show the discrete points used to construct the waveform.
- Show curve - Show the waveform created by connecting the discrete points.
- Description - A text description of the data.
To select a plot, do one of the following.
- Select it in the Channels tab of the Scope channels sidebar.
- Click the channel's ground indicator.
- Click the plot at one of its plot points. This can be difficult with small time intervals or overlaid channels.
- Choose the channel in the Selected Channel Toolbar.
Vertical (Channel) and Horizontal (Time) Toolbar
The Vertical and Horizontal Toolbar allows setting the scale of the vertical and horizontal divs, as well as shifting the vertical and horizontal offset. The vertical scale and offset affect the selected channel. The horizontal scale and offset affect all channels.

scale per vertical div, vertical offset, scale per horizontal div, horizontal offset, zero time offset button.
Vertical and Horizontal Toolbar Detail
- Vertical, V:
- Scale per vertical div - The number of units between each div. The channel's units will be displayed, where defined.
- Vertical Offset - The vertical offset, i.e. the amount the channel is shifted up or down from center of plot.
- Horizontal, H:
- Scale per horizontal div - The number of milliseconds between each div.
- Horizontal Offset - The time offset. Moves the vertical time offset indicator which defines relative t=0
- Zero Time Offset button - Sets the time offset to zero.
The Trigger Toolbar
Triggering defines when the scope plot is repainted. A trigger has occurred when the triggering channel value crosses the trigger level with the chosen rising or falling edge.
When running, the scope is always triggering in one of three modes.
- Normal - The scope will only plot when a trigger occurs. This is useful for periodic signals.
- Scan - The scope is artificially triggered at a fast rate to provide continuous plotting. This is useful for slow or non-periodic signals.
- Auto - The scope will operate as in normal mode as long as triggers are occurring regularly. If a trigger doesn't occur within a short period, the mode will operate as in Scan mode. If a trigger then occurs in the future, the scope will return to normal operation for the same short period. This is useful for periodic signals, when repainting in the case of noise is still desired.
Triggering is setup with the Trigger toolbar.

Mode, Channel, Edge, Level, Set trigger to mean, State, Single, and Run.
Trigger Toolbar Detail
- Mode - Set Auto, Scan, or Normal mode.
- Channel - Select the channel used to determine trigger level crossing.
- Edge - Set the rising or falling edge requirement for a trigger condition.
- Level - Set the value that the Channel must be to indicate a trigger crossing.
- Arithmetic Mean - Uses the channel's current minimum and maximum values to set the trigger to its average value.
- State - The current trigger state. Hover the mouse cursor over the state for a detailed tooltip.
- Single - Run until one trigger occurs, then stop.
- Run - Run/Stop the scope, which includes data acquisition and plotting on triggers.
The Measure Toolbar and Options
The scope provides several methods to measure time and data for the selected channel, plus a few options in the measure toolbar.
Time Cursor, Data Cursor, Measure Box, Measure Data, Measure Time, Track Points
Measure Toolbar Detail
- Time Cursor - Toggle the time cursors on or off.
- Data Cursor - Toggle the data cursors on or off.
- Measure Box - Change selection mode to allow dragging a rectangular region on screen to set the data and time cursors. Hit the ESC key to cancel.
- Measure Data - Change selection mode to allow dragging a vertical line on screen to set the data cursors. Hit the ESC key to cancel.
- Measure Time - Change selection mode to allow dragging a horizontal line on screen to set the time cursors. Hit the ESC key to cancel.
- Track Points - Change selection mode to allow dragging a crosshair around the plot displaying the value of the selected channel at the indicated point.Click again to turn off or hit the ESC key to cancel.
Cursors
Cursors provide a way to measure time and data on-screen. They measure the selected channel.
The Zoom Toolbar
The scope provides several methods to zoom into time and data.
Zoom Toolbar Detail
- Zoom into channel bandwidth - Uses the minimum and maximum of each channel to spread out the channels vertically so they share the vertical space without overlapping. Grounds may be off-screen. Also known as AC-Coupling.
- Zoom with channel ground - Uses the minimum and maximum of each channel to spread out the channels vertically so they share the vertical space without overlapping. Grounds will be on-screen. Also known as DC-Coupling.
- Zoom box - Change selection mode to allow dragging a rectangular region on screen to zoom into the selected region. Hit the ESC key to cancel.
- Zoom Trigger Channel Frequency - Uses average period of trigger crossings to set time base. If period cannot be found, trigger set to data mean. If period still cannot be found, time base is set to 5x (zoom out).
- Zoom Time - Change selection mode to allow dragging a horizontal line on screen to zoom into the selected time interval. Hit the ESC key to cancel.
- Zoom Data - Change selection mode to allow dragging a vertical line on screen to zoom the selected channel. Hit the ESC key to cancel.
- Zoom undo. Return to the last zoom level.
Utility Toolbar
The utility toolbar provides several help features.
Utility Toolbar Detail
- Show Plot Legend - Shows or hides an onscreen legend.
- Show Detail - Shows extra information including trigger count and current value of selected channel.
- Print - Print the scope.
- Export - Export the scope to several formats.
- Import - Import Galil Compressed Scope (gcs) format.
Export/Import
The scope data can be exported to a number of non-importable graphical formats including pdf, png, svg, and csv.
Galil Compressed Scope (gcs) is an export format that can be imported back into the scope at a later time. It includes all of the raw data record information captured in the scope at the time of export. Importing the gcs file later opens a scope in an offline mode. All data record sources, including those that weren't added as scope channels at the time of export, are available offline. This is a convenient format for storing and emailing scope data. Also, Windows will recognize the extension and open directly into GDK. Drag-and-Drop a gcs file into GDK to open it in the scope.
On-Screen Interaction
The GDK Scope has been designed to maximize on-screen interaction. The following is a list of ways to interact with the plot area with a mouse.
Selected Channel
Click a channel's waveform or ground indicator to change it to the selected channel.
Click-and-drag
- Selected channel vertically from the waveform or the ground indicator.
- The time offset horizontally.
- The trigger indicator vertically.
- The data cursors vertically.
- The time cursors horizontally.
When in zoom mode (ESC key to exit).
- The data zoom.
- The time zoom.
- The zoom box.
When in measure mode (ESC key to exit).
- The data measure ruler.
- The time measure ruler.
- The measure box.
- The track points crosshair.
Scroll Wheel
- Adjust vertical offset of selected channel.
- +ctrl Zoom in on selected channel data while keeping mouse location as zoom focus.
- +alt Adjust time offset.
- +ctrl+alt Zoom in on time while keeping mouse location as zoom focus.
![]()