 The PVT Tool
Introduction
The PVT tool allows the user to visually interact with the PVT (Position,Velocity,Time) mode of motion on the Accelera series of motion controllers. PVT allows arbitrary motion profiles to be defined by position, velocity and time individually on all 8 axes. This motion is designed for systems where the load must traverse a series of coordinates with no discontinuities in velocity. By specifying the target position, velocity and time to achieve those parameters, the user has control over the velocity profile.
Background: Learning about the PVT mode of motion
Features
- Open PVT data in CSV and DMC formats*
- Open Contour data in CSV and DMC formats*
- Convert Contour data to PVT data
- "Segments" view of each PVT point as it would be commanded by the user including elapsed time, total distance, incremental position, velocity, and incremental time. Segment data can be edited.
- "Kinematics" view of controller internal calculations for each sample including distance, velocity, acceleration, and jerk.
- Graphing capability
- Multiaxis graphing of Position, Velocity, Acceleration, and Jerk vs. time
- Single axis graphing of up to two data sets, e.g. Position and Velocity vs. time
- Two axis position vs. position graphing for coordinated motion planning
- "Motion Summary" providing timing, and maximum velocity, acceleration and jerk throughout the move.
- Stream capability to connect to a controller and stream an arbitrarily long segment list.
* The PVT tool will read DMC format PV and CD commands when coded explicitly. Programming loops which populate the contour or PVT buffer can not be opened in the PVT tool.
Open
The PVT tool can open data in one of four formats:
- Contour CSV data (*.cm.csv)
- Contour DMC data (*.cm.dmc)
- PVT CSV data (*.pvt.csv)
- PVT DMC data (*.pvt.dmc)
Save
The PVT tool can save data in one format:
- PVT CSV data (*.pvt.csv)
Saving data requires a GDK Pro license.
Print will allow printing of the segments or kinematics data. For large datasets, a range feature allows the user to only print the data of interest.
Table Display | Segments
Segments view displays data as entered by the user into the PVT mode (e.g. PVA=1000,-2000,256). Elapsed Time and Total Distance are displayed for convenience. Cells with a white background can be edited. Each row represents a segment, as would be input into the PVT segment buffer. Multiple axes are displayed side by side.
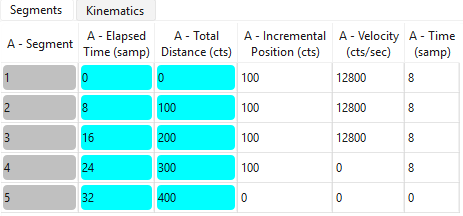
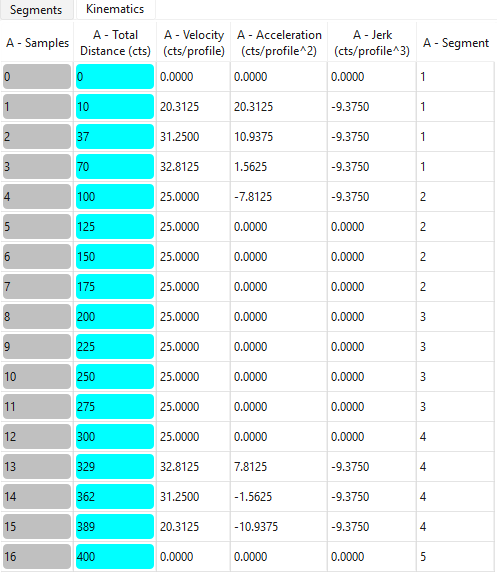
Table Display | Kinematics
Kinematics view displays data as calculated internally by the PVT mode of motion. With this screen, the user can browse the motion kinematics within a segment. Typically, many profile points will occur for each segment point. To determine the number of profiles in a segment, take the final argument to the segment (e.g. PVA=1000,-2000,256)and divide by two.
This view is non-editable.
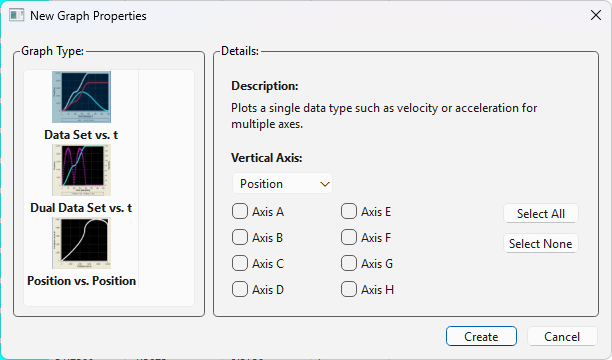
New Graph
The New Graph menu item allows various visualizations of the PVT data.
- Data Set vs. Time provides a graph of any kinematic quantity (Position, Velocity, Acceleration, or Jerk) for any or all of the axes vs. time.
- Dual Data Set vs. Time provides a graph of any two kinematic quantities for a particular axis vs. time
- Position vs. Position provides a graph of two axes' position data plotted against each other.
Graph Features
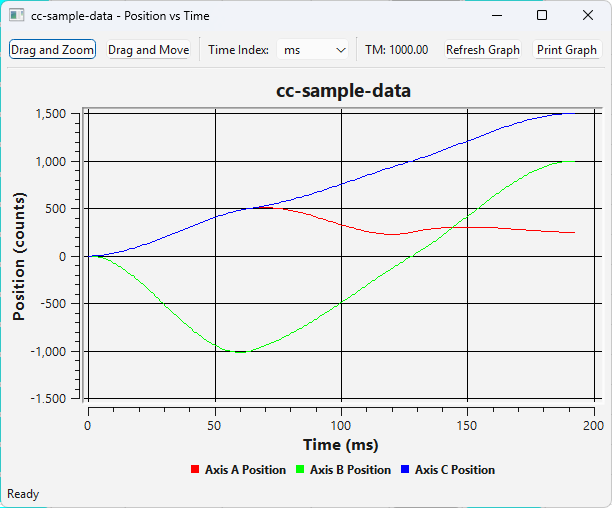
- Multiple graphs can be opened simultaneously and changes in the segment view will auto-update all graphs
- Clicking on a graph trace will return the relevant values for that point in the bottom of the graph window.
- With the mouse cursor over the graph area scroll the mouse wheel to zoom.
- Click Drag and Zoom to enable zoom box mode. Click and drag a rectangle to zoom in. Right-click to unzoom. Click the button again to disable Drag and Zoom.
- Click Drag and Move to enable pan mode. Click and drag in the graph area to move the graph. Click the button again to turn off pan mode.
- Time Index allows a choice on the time-based data. Choose samples for controller samples, and ms for real time. Click the Refresh Graph button to redraw.
- The "Print Graph" button allows the user to print the graph.
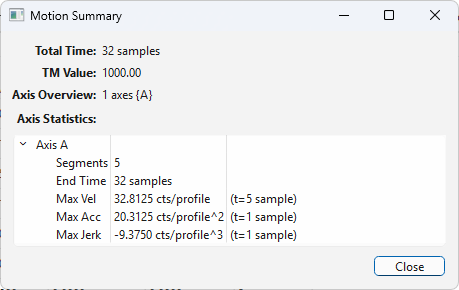
Motion Summary
The Motion Summary window provides an overall statistical view of the entire movement showing absolute maximums.
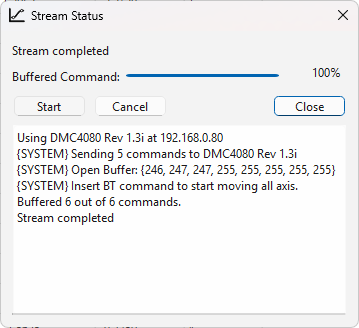
Stream Commands
Stream Command allows the data in the PVT tool to be commanded to the controller. The PVT tool will stream arbitrarily long PVT trajectories.
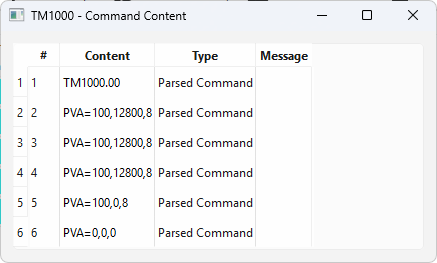
View Commands
The View Commands shows the activity of the internal parser. This screen is for debug purposes and need not be used unless unexpected behavior occurs.
Glossary
Contour Mode
Contour mode allows the user to specify segments with a delta-time(DT) and a delta-position(CD). The controller firmware will linearly interpolate the position to achieve the delta-position during the delta-time interval. The delta-time argument is specified by n, where 2n samples determine the interval. Velocity discontinuities can occur at each segment boundary, with velocity constant during the segment.
CSV
CSV, or Comma Separated Values, format is a simple, widely-supported format for the distribution of table data. Each table row is separated by a carriage return, and each table cell is separated by a comma.
PVT Mode
PVT mode allows the user to specify segments with a position to reach, a velocity to attain, and a time in which to attain them. A key difference with PVT vs. Contour, is that with PVT, velocity and acceleration stay continuous, while jerk is discontinuous. By moving the discontinuity two kinematic derivatives down (p'(t)=velocity, p'''(t)=jerk), PVT generally provides smoother motion than Contour, while still reaching the desired points at the appropriate times. PVT is less trivial to command, however, hence the PVT tool.
sample
In a digital motion controller (DMC) real time is split up into discrete parts, called samples. The servo control law, motion profiling, and other controller functions are timed in samples. Samples relate to real time as a function of the number of samples in a duration of real time. By default, Galil controllers break one second into 1024 samples, though this sample rate can be made faster or slower with the TM command*. It is important to know what sample rate the controller uses in order to understand how the internal calculations of the hardware relate to real world, time-based quantities such as velocity, acceleration, and jerk.
*Changing the sample rate with the TM command can be advantageous, and also can be troublesome, depending on the application. To determine if changing the TM sample rate will benefit your application, please contact Galil to discuss with an applications engineer.
segment
Buffered modes of motion (Contour, PVT, Vector, Linear Interpolation) maintain a buffer of data for the motion profile. Users supply this data and the mode of motion uses it to create motion profiles based upon the mode's unique algorithm. The atomic unit of data in a buffer is called a segment. Each segment contains all the information necessary for the mode of motion to generate motion. Multiple segments are buffered to create arbitrarily long motion paths. In PVT mode, a segment contains position, velocity and time information.
![]()