 The Plotter Tool
Description
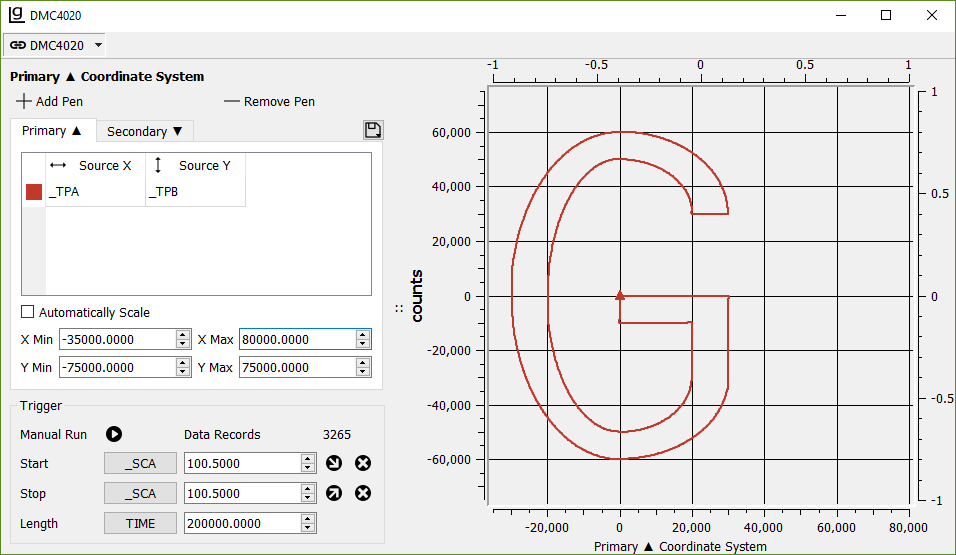
The plotter tool allows the user to configure a plot of the desired data using custom coordinate systems. Multiple datasets can be plotted together for easy comparison.
Adding Pens
To add a plot to a coordinate system click the ![]() Add Pen button at the top left of the tool
Add Pen button at the top left of the tool
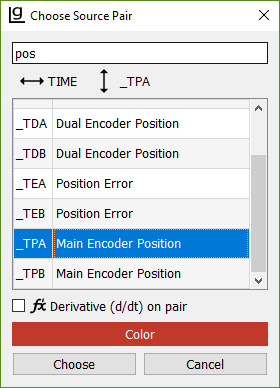
From the Add Pen window, choose a source pair for the horizontal and vertical axes. Sources can be filtered using the text box. A derivative (d/dt) of the pair can also be plotted. Each pen can be given a unique color.
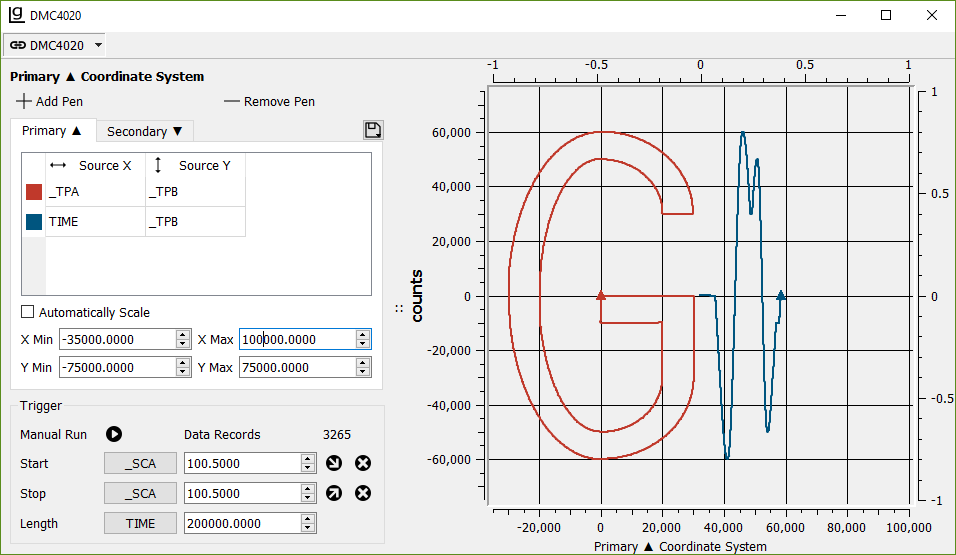
Any number of pens can be added to the same plot. Add a pen to the secondary coordinate system to separate it from the primary coordinate system. The plot will be drawn
with a ![]() if it is drawn on the primary coordinate system and with a
if it is drawn on the primary coordinate system and with a ![]() on the secondary coordinate system.
on the secondary coordinate system.
Some data record data is affected by settings on the controller. For example, the AQ command affects the scaling of analog inputs. Setting up these commands first, before opening a Plotter and adding pens, will ensure that the data is interpreted correctly.
Plot Features
Scaling the plot
The primary and secondary coordinate systems can be scaled separately. Each can be set to automatic scaling or manual scaling. The scale for the primary coordinate system can be found at the bottom and left sides of the plot. The scale for the secondary coordinate system can be found at the top and right side of the plot.
Plot Zoom
Left click and drag to zoom in on any plot. Multiple zooms can be performed and are stored in a queue. Middle mouse click will go back one zoom, and a right click will restore the default scale.
Cursor Coordinates
Hover the cursor over the plot to get precise coordinates for the selected coordinate system.
Importing/Exporting Plots
Click the ![]() Import/Export icon to Import/Export a (.gcp) file. A (.gcp) file can be saved and viewed later, or emailed to Galil Customer Support
to help debug any issues.
Import/Export icon to Import/Export a (.gcp) file. A (.gcp) file can be saved and viewed later, or emailed to Galil Customer Support
to help debug any issues.
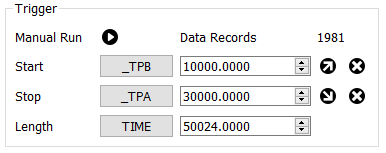
Trigger Menu
The trigger menu allows the user to set conditions on when the plot will start and stop as well as the length of the plot pen. Click the button next to Start and Stop and select
a source. Set the values for the conditions that the plot will start and stop and select either a ![]() Rising or
Rising or ![]() Falling edge.
Falling edge.
Finally, select the length condition that will determine how long the pen will draw. Drawing for a time duration is typical, but other lengths can be helpful. For example, use _AVS to plot a specified length of a vector sequence running in the S plane.
![]()