 The Debugger Tool
Description
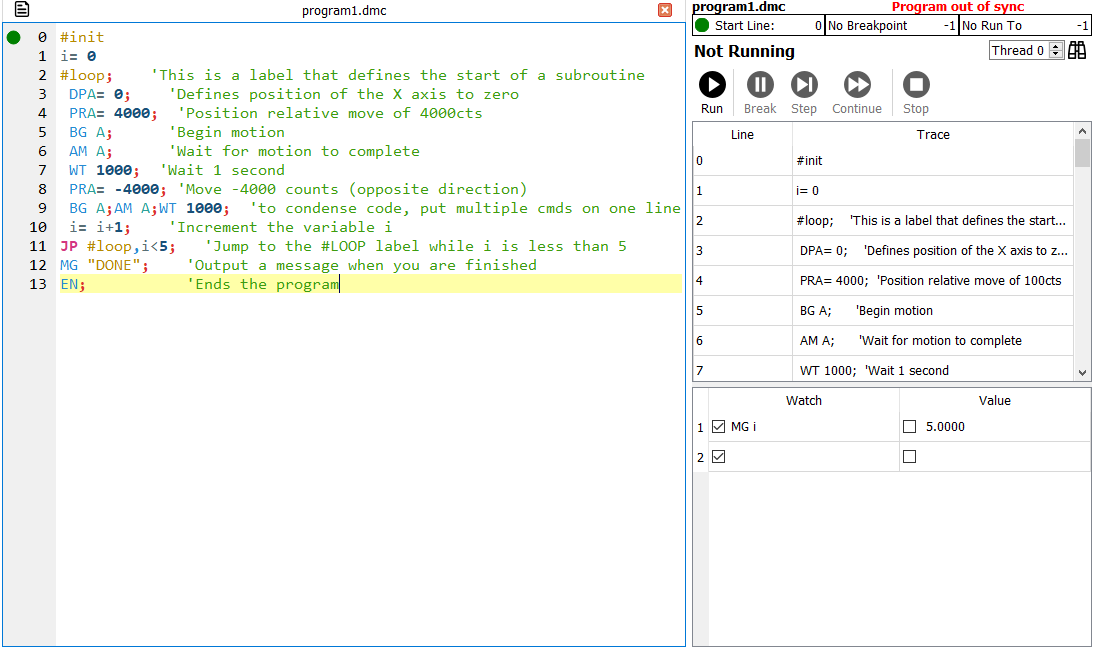
The Debugger Tool is an extension of the Editor Tool that allows the user to watch commands, set breakpoints, and step through the DMC application code line-by-line.
Breakpoints
The Debugger Tool allows the user to control the flow of the program with Breakpoints
Setting Breakpoints
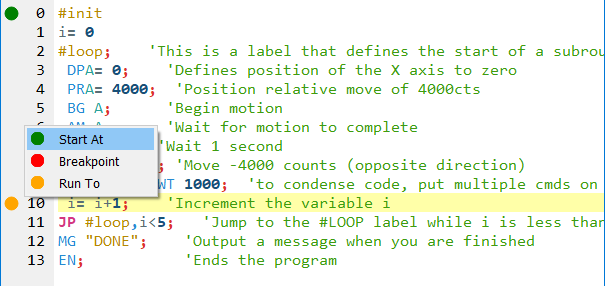
Right clicking a line number in the Editor Tool will give the option to set that line as a breakpoint, start point, or run to point. A left click will toggle a breakpoint on and off.
Program Flow
Click ![]() Run to begin executing in debug mode. The program can be
Run to begin executing in debug mode. The program can be ![]() Stopped or
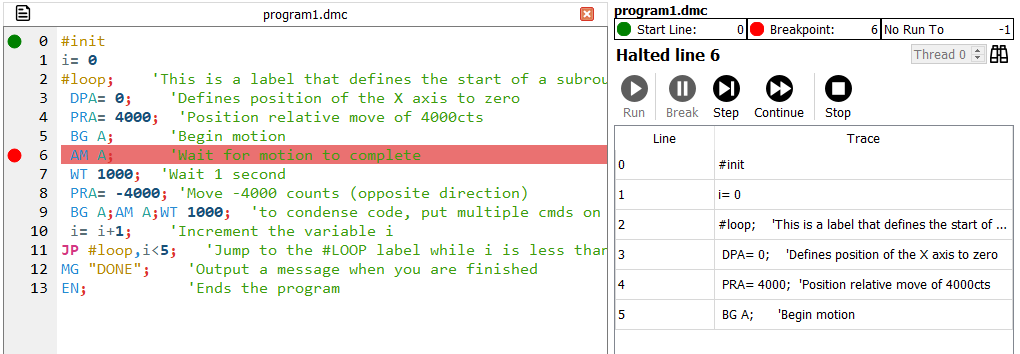
Stopped or ![]() Paused any time using the buttons on the right side of the tool. When the program reaches a breakpoint,
the corresponding line will be hightlighted in the editor and the program will halt. From here the user can choose to
Paused any time using the buttons on the right side of the tool. When the program reaches a breakpoint,
the corresponding line will be hightlighted in the editor and the program will halt. From here the user can choose to ![]() Continue the program or
Continue the program or ![]() Step through line by line. The right side of the tool
displays the currently executed line as well as a list of previously executed lines.
Step through line by line. The right side of the tool
displays the currently executed line as well as a list of previously executed lines.
Watch Commands
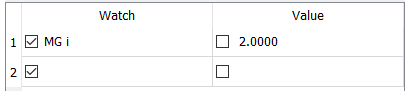
By entering a command such as "MG i" into the Watch Box, the user can watch the value of a command throughout the program's execution. The values in the Watch Box are polled continuously and are updated live throughout the execution of the program.
![]()