Debugging Galil code with GalilTools is accomplished with a few basic commands:
| Command | Description |
|---|---|
| TR1 | Trace. Prints each command as it's executed. |
| MG | Print message strings, variables, and controller parameters. |
| MG _XQn | Print current line number that is executing in thread n (or -1 if thread is not running) |
| LV | List all declared user variables and their values |
| LS | List the controller program |
| LS first line, last line | List a program section |
| LS_XQn,_XQn | List current running line of code |
| QU array[] | Print the contents of a given array |
| SC | Stop code for axis |
| TC1 | Tell error code and brief description (reason for controller returning a "?") |
| XQ | Begin Program |
| ST | Stop Program |
| BK line | Set breakpoint at line |
| BK | Resume from breakpoint |
| SL | Single Step |
Messages (MG) can be placed in key points or subroutines to determine whether the program has executed that particular line. Stop codes (SC) will return the cause of a stopped axis and are helpful in determining motion issues. TC1 will return any error codes generated in the controller program; however, GalilTools will automatically return a COMMAND ERROR in red if one is generated from the Terminal. Once GalilTools displays the error code, it will be cleared from controller memory (TC returns 0). When the error code appears in the Terminal window, please refer to application note 2443 for further information.
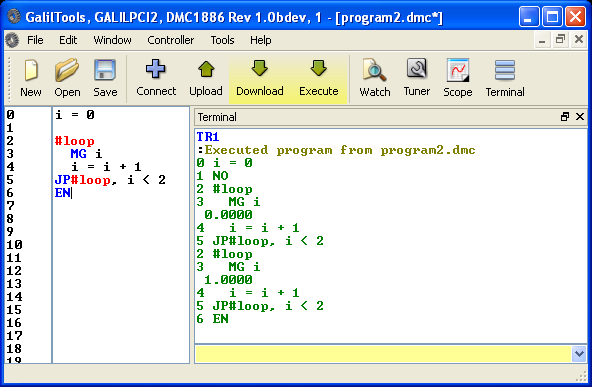
A useful debugging tool is the trace (TR) function. By enabling trace, all commands in the controller program will be printed as they are executed, allowing for program flow analysis and simple debugging. The following shows a simple program and the Terminal output of the trace function (note that each program line is preceded by its line number):
|
| Example of the trace function |
If multiple threads are executed with the TR command enabled, the user will see the executing lines interleaved (e.g. thread 0 line 0, thread 1 line 0, thread 0 line 1, thread 1 line 1, etc.). Note: comments preceded with a single quote ' or NO are evaluated as no operation commands.
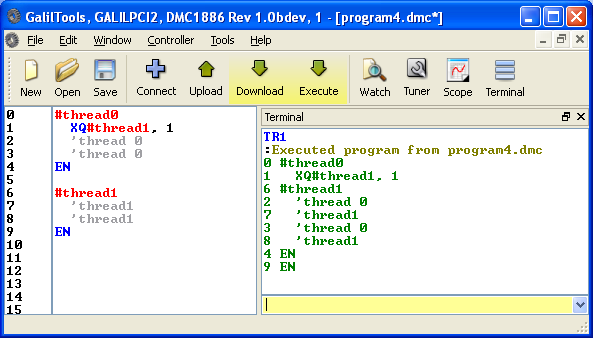 |
| Executing thread lines are interleaved in the trace output |
The Accelera series controllers have a thread-selectable trace function, which allows only executing lines of specified threads to print (see TR in your Accelera command reference).
Breakpoint (BK) and Single Step (SL) allow the user to control the flow of an executing program. Below is a GalilTools setup to debug some example code. In this example, the motion is supposed to profile 1000 counts, but a bug in the exit condition of the iterative loop has caused a "fencepost" error and only 900 counts are profiling.
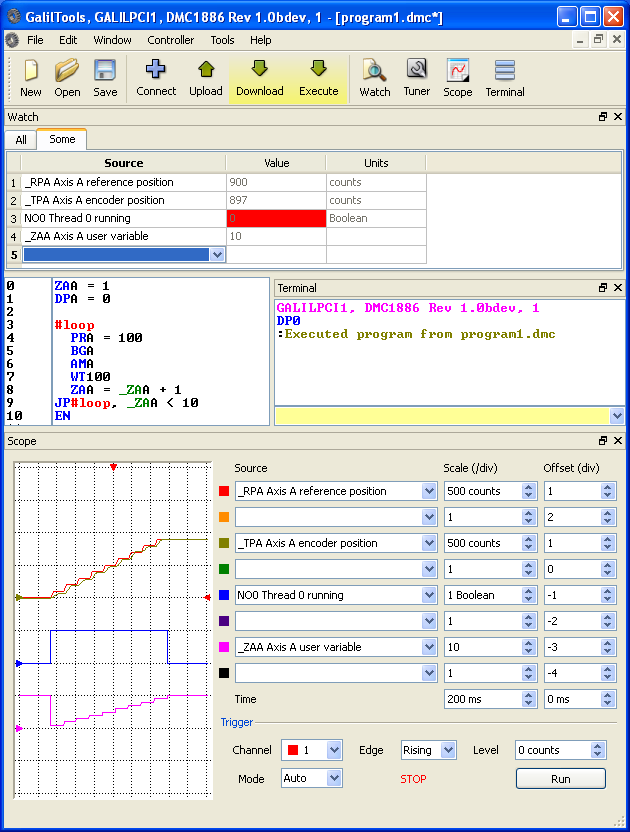 |
| Debugging Example. Target stops 100 counts before target. |
If it were unclear why only 9 movements have been made, a breakpoint could be set at BGA on line 5 with BK5 to break at each individual move and turning on TR gives further information.
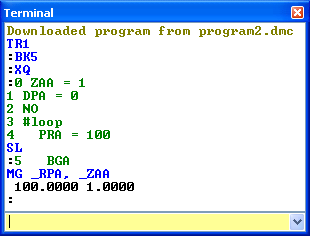 |
| After issuing BK5 and XQ, the execution pauses before line 5. SL single steps into line 5 and interrogating _RPA and counter variable _ZAA shows all is in order so far. |
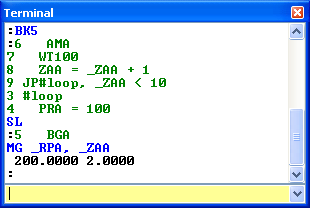 |
| Issuing BK5 again allows the execution to continue through one loop iteration and pauses again at line 5. Single stepping and interrogating shows as expected. |
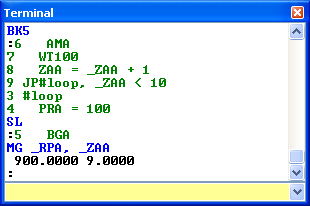 |
| Continuing in the fashion brings us to the 9th iteration. The position is 900 and the counter is 9. |
 |
| Expecting another iteration, we issue BK5. The code continues and exits without iterating again and the early exit condition becomes clear (line 0 should read ZAA=0). |
Breakpoint (BK) and single step (SL) can be used to great utility to diagnose difficult bugs; however, printing messages with the MG command often works for quick checks:
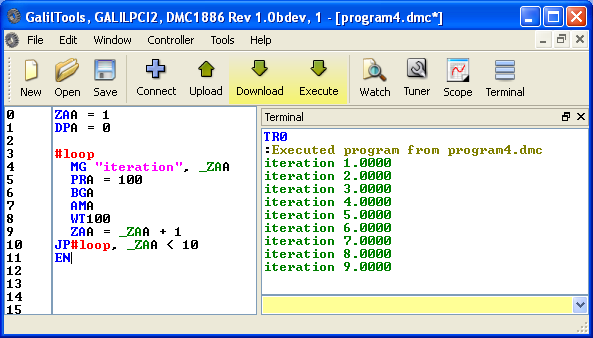 |
| Line 4 has been added to print a message on each loop and the early exit is also evident. |